(Página también en español)
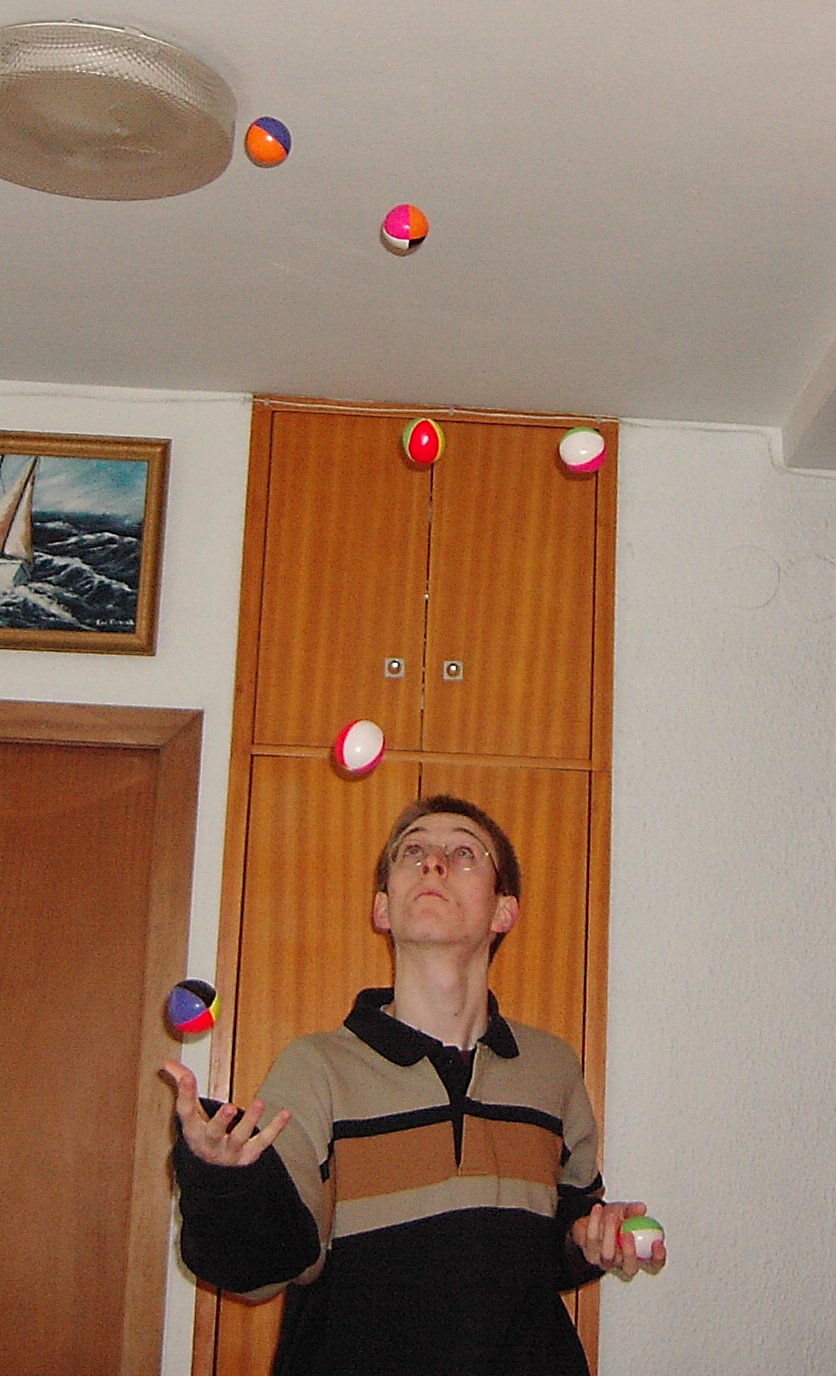
schart.pl is a Perl script to print charts of state diagrams, a useful juggling notation which helps to discover new siteswaps and transitions between patterns.
It can show the transition table, or the adjacency matrix with each possible throw type; for a fixed number of balls or for any (then it includes pickups and drops). You must specify the maximum throw height.
You can combine this program with txt2tags (a text formatting tool) to convert the output to several formats, like TeX (so the PDF can be done easily) and HTML (use CSS with it!, or make a spreadsheet program import the data).
schart.pl is free software (GPL) and probably runs
on your operating system.
Download: schart.pl, version 1 (colorized code here).
25-March-2005, by Daniel Clemente Laboreo.
Mark Thomas has a good description of them: State Transition Diagrams. You should read his tutorial before you can understand this program.
Anyway, a fast description: a state is a binary string
that tells us when the balls would land at our hands. Each ball is
represented by one 1, and the string is a
queue from where the juggler takes balls from the right,
one at a time.
For example, we have 111 (3 ones => 3 balls).
The juggler throws a 5, and we have 10011 (the ball
has moved back 5 steps; the rightmost 1 is no more at
the right but 5 positions to the left). Then throws a 3, and we're
at 1101, then a 1, and we're at 111
again, since we have gone through 531, a valid siteswap pattern.
Learn this "siteswap"
thing.
When you're in a state which ends in 1, you can
also drop the ball: for example, from 1100101 you end
in 1100100 (that doesn't count as a time tick). You
can also pick a new ball if the state ends in 0: after
the 1 of a 441 you're in
1110 and can take a ball to end in 1111
and do the 4 ball fountain.
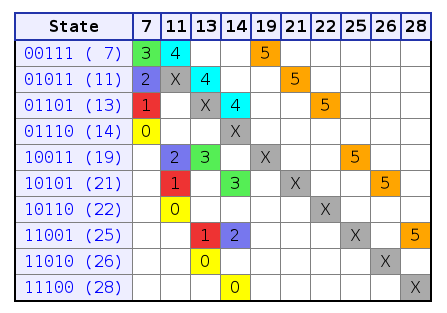
A state chart (example) is a table which lists all the possible throws that can be made at each state, and the result state for each one. It's in fact the transition table of a DFA (Deterministic Finite-state Automaton).
  Usage: ./schart.pl -m max_throw [-n balls] [-t] [-x] [-h]

  -m max_throw : which throw heights to consider (from 0 to max_throw).
  -n balls     : only show states with that number of balls; no drops or pickups.
  -t           : show the throw types inside the table, and use the "final state"
                 as the horizontal axis. Easier to understand, but tables are
                 giant (2^max_throw rows and 2^max_throw columns).
  -x           : when -t is on, add X marks as reference points
  -h           : show this help
0 to
2^max_throw-1. You can filter them so that the table
only refers to states with the specified number of balls.
Consequently, the signs for "pickup" (+) and "drop" (-) are not
shown, as the number of balls doesn't change.-t, each row shows the
throw type that will lead you to every state.
There's a column for every state, so the table is square and
probably very large, but easier to use due to the X
marks (see -x). Compare -m5
(without -t) and -m5 -t
-x.-t is also used. This
option puts Xs on the diagonal of the table (which is
square); notice that the row value and the column value are the
same. They serve as reference points because to select a throw, you
only will have to move horizontally. When you find your desired
throw type, you move down or up along that column until you find
the X, and you're on the result state (throw
again).Example: ./schart.pl -m5 -n3 -t -x shows patterns
with 3 balls using throws 0, 1,
2, 3, 4 and 5.
A beautified version of the table is here:
Start at a state you know, for example the cascade (e.g.
111) or the fountain (e.g. 1111). Move
horizontally and decide which throw you want to make. When done,
move vertically until you find the X (or the
diagonal). This way you have moved to the result state for
that throw type. Now repeat the process: continue moving
through states and eventually try to reach the initial state again
so that you have a complete siteswap.
Try to find 333, 423,
55500, 53403, 45141,
522, 42, 52530, etc. in the
table above. And also the ones which don't start from
111: 450, 51, etc. And don't
forget to try every pattern in the real life :-)
Just find your way through the table. Imagine you want to do
450 but don't know how to start (you're on state
111). Throwing a 4 would get you to state
11, the 5 to 21, but then there's no possible
0, so that wasn't the way.
Look for other 4 in the table which could start the
pattern. There are only 3, and the ones from state 7 and 13 don't
work for 450, so you should start from state 11. And
how to get to state 11 from state 7? Well, there's a direct way:
throwing a 4 (the gray X shows us the column of throws
which lead to state 11).
So the transition is ...3 3 3 3 4 450 450 450 ....
As an exercise, go back to 3 3 3 3... again. You can
decide it just after the 4 or just after the
0. Just after the 5 you can't because at
state 22 there's only one election.
I coded it in two days only to practice Perl. The manual page
(man perlintro) was of great help.
You may find inefficient algorithms (if you tell me I might improve them). But it's Perl, TMTOWTDI, ATINTBO (and this is not the best one).
I myself can't do all these patterns, but I will practice more. For the moment I can do 4 ball Mills Mess, and qualify 7, but a lot of 3 and 4 ball siteswaps continue being a challenge.